Visual Debugging of GameplayKit GKComponent
Use Swift protocols together with GameplayKit's GKComponents for a convenient and flexible way to add all kinds of optional visual debug info during gameplay.

When coding games, it can be useful to be able to visualize values in real-time to monitor that algorithms behave as expected and that data is generated correctly. You don't want to feel that you are working against a black hole, hoping for the best that every part of the game works as intended.
Writing a test suite can help somewhat with this, or even sometimes just printing data to the console will do the trick. As games most of the time are a visual experience, getting visual feedback of behaviors during play testing can be extremely useful and time saving and to help feel confident that the implementations are solid.
If you use a game engine like Unreal or Unity, you get some stuff like this "for free" but when we code our own games with Swift in Xcode, we have to implement our own systems to handle the visualizing of crucial values in our games to check that all the parts work as intended.
Use Cases
As this is only intended to be used during development and testing, and will never be shipped to the players in release builds, there is no need to make something pretty.
The point of these visualizations is to simply show the data in an easy to understand manner so it can be analyzed that it works as intended.
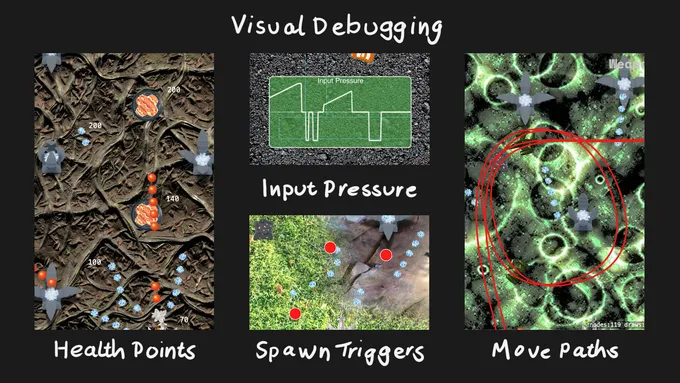
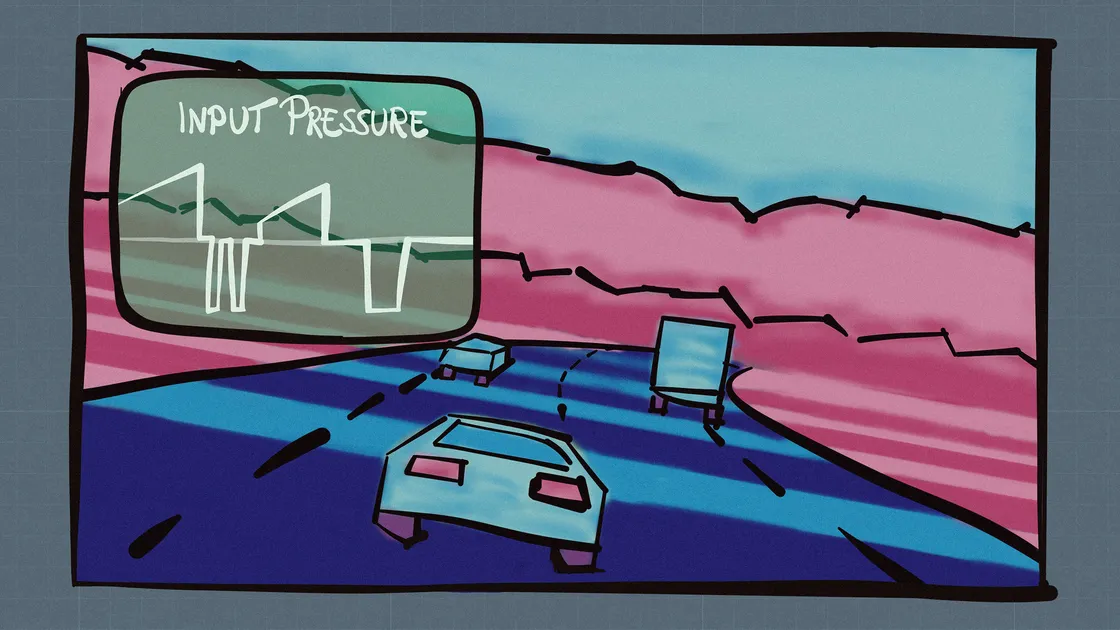
I've been building systems for this to keep track of values like enemy healthpoints, simulated input pressure, generated movement paths and many more things.
Implementation Example
Let's study a concrete example, how this can be implemented using the Swift programming language. I'm basing this on using GameplayKit and SpriteKit, but it can easily be adopted to other frameworks.
Visual Debug Protocol
I rely heavily on the Entity Component System provided with GameplayKit, so most of my logic is contained within GKComponents. I'm using a custom protocol with GKComponent that I can implement for components that contain values that I need to analyze visually.
#if DEBUG
/// Protocol to enable/disable visualization of debug info in `GKComponent` objects.
protocol GKComponentDebuggable {
  /// Enable display of debug info.
  func enableDebugInfo()

  /// Disable display of debug info.
  func disableDebugInfo()

  /// Update loop to run debug specic logic.
  func debugUpdate(deltaTime seconds: TimeInterval)
}
#endif
With these three methods in my GKComponentDebuggable protocol I've been able to handle all my visualization needs I've had so far. enableDebugInfo() allows me to do
any initialization, in disableDebugInfo() I do the cleanup and in debugUpdate() I can handle any changes needed on a frame by frame basis.
Debug Core Setup
I handle the setup to enable, disable, and update the components that implement the GKComponentDebuggable in my main GameplayScene class. That is the class that takes care of all the core management of my game systems.
class GameplayScene {
  #if DEBUG
  /// Tracks the state if debug info shall be displayed.
  var debugInfoEnabled = true {
    didSet {
      debugInfoEnabledDidChange()
    }
  }

  /// Root layer of nodes to display movement graphs for debugging.
  let debugGraphLayer = SKNode()
  #endif

  override func didMove(to view: SKView) {
    // ... other initialization code would be here ...

    #if DEBUG
    // Add layers to display debug info to the scene.
    debugGraphLayer.zPosition = LevelLayer.debug.rawValue
    worldNode.addChild(debugGraphLayer)

    // Call didChange once so it can start with debug mode on if enabled.
    debugInfoEnabledDidChange()
    #endif
  }

  // ... And here continues the rest of my GameplayScene class ...
}
I'm using two properties. debugInfoEnabled allows me to define if I should start the game with debug info in an enabled state. When the value is changed, I call a dedicated debugInfoEnabledDidChange() method that handles all states when it comes to visual debug info. This is not limited to the things I show with GKComponentDebuggable as I also have other debug info I enable that are not related to specific components.
debugGraphLayer is a sub-root node that is available in the GameplayScene when making a Debug build, that all GKComponentDebuggable implementations can use to add their visuals to. This is set to a Z depth above everything else in the scene.
During the scene's lifecycle, I initialize the debugGraphLayer node at the end of didMove(to:).
Okay, let's move on to interacting with the protocol.
#if DEBUG
// Extend GameplayScene to add methods to display debug info.
extension GameplayScene {
  /// Toggle display of debug overlay metrics.
  func debugInfoEnabledDidChange() {
    // ... other debug info handling....

    // Toggle debug info in components.
    for componentSystem in componentSystems {
      toggleDebugInfo(for: componentSystem.components)
    }
  }

  /// Toggles debug info for provided array of components.
  func toggleDebugInfo(for components: [GKComponent]) {
    for case let component as GKComponentDebuggable in components {
      if debugInfoEnabled {
        component.enableDebugInfo()
      } else {
        component.disableDebugInfo()
      }
    }
  }

  /// Update loop to run debug specic logic.
  func debugUpdate(deltaTime seconds: TimeInterval) {
    // Exit right away if we don't display debug info.
    if !debugInfoEnabled { return }

    // Update component systems.
    for componentSystem in componentSystems {
      for case let component as GKComponentDebuggable in componentSystem.components {
        component.debugUpdate(deltaTime: seconds)
      }
    }
  }
}
#endif
To keep it neat and tidy, I've added the debug handling code in an extension to the GameplayScene class that is only included in debug builds. I've three methods in this extension that manage the debug visualization.
debugInfoEnabledDidChange() is the method we call when we change the debugInfoEnabled property in the GameplayScene above, that handles toggling all different debug visualizations on and off.
In the method, I loop through the componentSystems property. Which is an array of [GKComponentSystem] that holds references to all currently active component systems in the game. That is the standard behavior of ECS in GameplayKit and a bit out of scope for me to go deeper into in this article.
This is the same array I loop through in my standard gameplay update loop, to update all components on each frame iteration.
override func update(_ currentTime: TimeInterval) {
  // ...

  for componentSystem in componentSystems {
    componentSystem.update(deltaTime: Time.deltaTime)
  }
}
Then we have toggleDebugInfo() which takes an array of GKComponents. This is the method we call from debugInfoEnabledDidChange where we pass in the components from each component system. But I also call this method manually when a new entity is added to the game during gameplay in debug mode, to enable visualization if required.
This method simply loops through the components and then calls the enableDebugInfo() or disableDebugInfo() on each component that has implemented the GKComponentDebuggable protocol.
And finally we have the debugUpdate(deltaTime:) method. Just like previous methods, this method loops through all components in each component system to see which ones implement GKComponentDebuggable, and for those that does, the debugUpdate(deltaTime:) method is called in the component.
This method is called last in the regular gameplay update loop when building a debug build.
override func update(_ currentTime: TimeInterval) {
  // ...

  #if DEBUG
  // Run update loop for debug info and overlay.
  debugUpdate(deltaTime: Time.deltaTime)
  #endif
}
Example
With all this in place, let's see an example, of an actual implementation in a component.
#if DEBUG
// MARK: - Debug

extension EnemyAIComponent: GKComponentDebuggable {
  func enableDebugInfo() {
    guard let scene = renderComponent.node.scene as? GameplayScene else { return }

    // Configure path display
    let shape = SKShapeNode(path: self.path)
    shape.lineWidth = 3
    shape.strokeColor = .red
    shape.name = NodeName.componentDebug
    shape.position = startPos!

    // Store a reference to the entity in the path so we can find it later as it is displayed directly in the scene and not as a child of anything relating to the entity.
    shape.userData = ["entity": entity!]

    scene.debugGraphLayer.addChild(shape)
  }

  func disableDebugInfo() {
    guard let scene = renderComponent.node.scene as? GameplayScene else { return }

    // Find and remove the path in the graph layer.
    scene.debugGraphLayer.enumerateChildNodes(withName: NodeName.componentDebug) { [weak self] (node, _) in
      guard let entity = node.userData?["entity"] as? GKEntity else { return }

      if entity == self?.entity {
        node.removeFromParent()
      }
    }
  }

  func debugUpdate(deltaTime seconds: TimeInterval) {
    // Not needed in this component.
  }
}
#endif
In this example, I extend EnemyAIComponent to visualize the path on screen that an enemy gets assigned when spawned. So during the enableDebugInfo() phase, I take the path property already available in the component and draw the path to screen with a SKShapeNode.
I use disableDebugInfo() to remove the path when the entity is removed.
In this case the path does not change during the component's lifecycle, so I don't need to call debugUpdate(deltaTime:). Otherwise, I'd have used this method to update the drawn path during the life span of the component.
Conclusion
There are of course many ways to skin a cat, but for me, I've found that this protocol-based approach together with the ECS system of GameplayKit has worked out great while keeping the code clean and easy to navigate.
While I just scratched the surface here of what one can do, I can imagine taking the concept further to a full-blown in-game console to be able to interact with the protocol and even other game data live during gameplay for even faster iterations.
And other times, a simple print statement to the Xcode console might be enough. I'd put my solution above somewhere in between, which fulfills the purpose fast and efficiently in many day to day scenarios to analyze game data.